Metro Council Rail · Internal Art Review

3D Art Estimate Red-Flag Review

A production-only lens for reviewing the train, route, station, landmark, and environment assumptions. The goal is not to re-price the project; it is to find quantity, fidelity, reuse, and allocation problems before the art estimate is treated as locked.

Raw 3D production7,195.5 h6,498.5 artist + 697 tech art
Raw production value$1,439,100At the $200/hour proposal rate
Buyer-facing art rows$1,857,337Train + full routes in current workbook
Unlabeled load+$418,23729.1% above raw production art
Highest-value checks

Red Flags to Resolve

These are review triggers, not automatic cuts. Each one can move hours materially or make the same scope appear in incompatible ways across the workbook and estimator.

Bottom line: the 7,195.5-hour total is almost identical to the prior 7,200-hour internal art anchor, but the allocation underneath it changed materially. Matching the old total does not validate the current quantities.
Critical · Quantity

“39 Reused” Became 6

The cost-workbook description promises 27 unique stations and 39 reused stations. The live estimator prices 27 unique and only 6 reused. If “reused” means station placements, 33 instances are unpriced.

33 × 50 h = 1,650 h · $330,000
Reviewer call: Define whether “39 reused” means placements, templates, or no additional production effort.
Critical · Reuse logic

Reuse Has No Discount

Unique and reused stations are both set to 43 artist + 7 tech-art hours each. That is not a reuse model; it is identical unit pricing with a different label.

Unique = 50 h each · Reused = 50 h each
Reviewer call: Set separate hours for the master station, variant kit, and each placement/customization pass.
High · Allocation

Buyer Art Is 29.1% Above Production

The two buyer-facing art rows total $1,857,337, while the live estimator's explicit train and route production children total $1,439,100. The $418,237 difference may be deliberate project loading, but it is not labeled in the art rows.

$1,857,337 − $1,439,100 = $418,237
Reviewer call: Identify PM, QA, overhead, contingency, or cross-feature allocation explicitly.
High · Scope basis

Three Different Mileage Bases

The workbook promises 50.75 route miles. Near-field quantities total 53 miles because each segment is rounded up, while mid/far environment uses 50 miles. This may be conservative, but the basis is not consistent.

Near field 53 mi · Mid/far 50 mi · Scope 50.75 mi
Reviewer call: Choose exact segment miles, rounded estimating units, or a documented allowance—then use it everywhere.
High · Hidden logic

Station Rows Show Hours but Price at $0

Blue, Green, shared, and extension station rows retain 43 artist + 7 tech-art hours per unit, yet each rolls up to $0. The estimator instead prices “unique” and “reused” station rows. This is easy to misunderstand or reactivate accidentally.

5 populated station lines · $0 effective price
Reviewer call: Delete/disable superseded inputs visibly or document the replacement rollup in-row.
High · Fidelity

One Rate Covers Every Landmark

All 40 points of interest receive 21.5 hours each. A skyline mass, station-adjacent landmark, stadium facade, bridge, and generic background block do not have the same production cost.

40 × 21.5 h = 860 h · $172,000
Reviewer call: Name the 40 assets and assign hero, mid-detail, or silhouette tiers.
High · Acceptance

Yards and Turnouts Get 50 Hours Each

Four yard/turnout environments receive 50 hours each. That is plausible only for bounded, operator-visible representations using strong source data—not full operational yards, switch networks, signage, catenary, and facilities.

4 × 50 h = 200 h · $40,000
Reviewer call: Define camera envelope, interactive track elements, signals, catenary, and acceptance shots.
High · Vehicle delta

S70 Visual Delta Is Only 86 Hours

The allowance covers all visible S70/S700 differences at 86 artist hours and no tech art. That is adequate only if the delta is tightly limited and reference-ready.

86 h · $17,200 production
Reviewer call: List the exact geometry, materials, display surrounds, mirrors, lighting, markings, and validation passes included.
Live estimator · explicit art children

Production Breakdown

Costs below are simple hours × $200. Parent rollups are excluded to avoid double counting. Project-level PM, QA, and overhead are not added here.

Production itemQtyHours / unitArtist hTech-art hTotal hProduction $Review lens
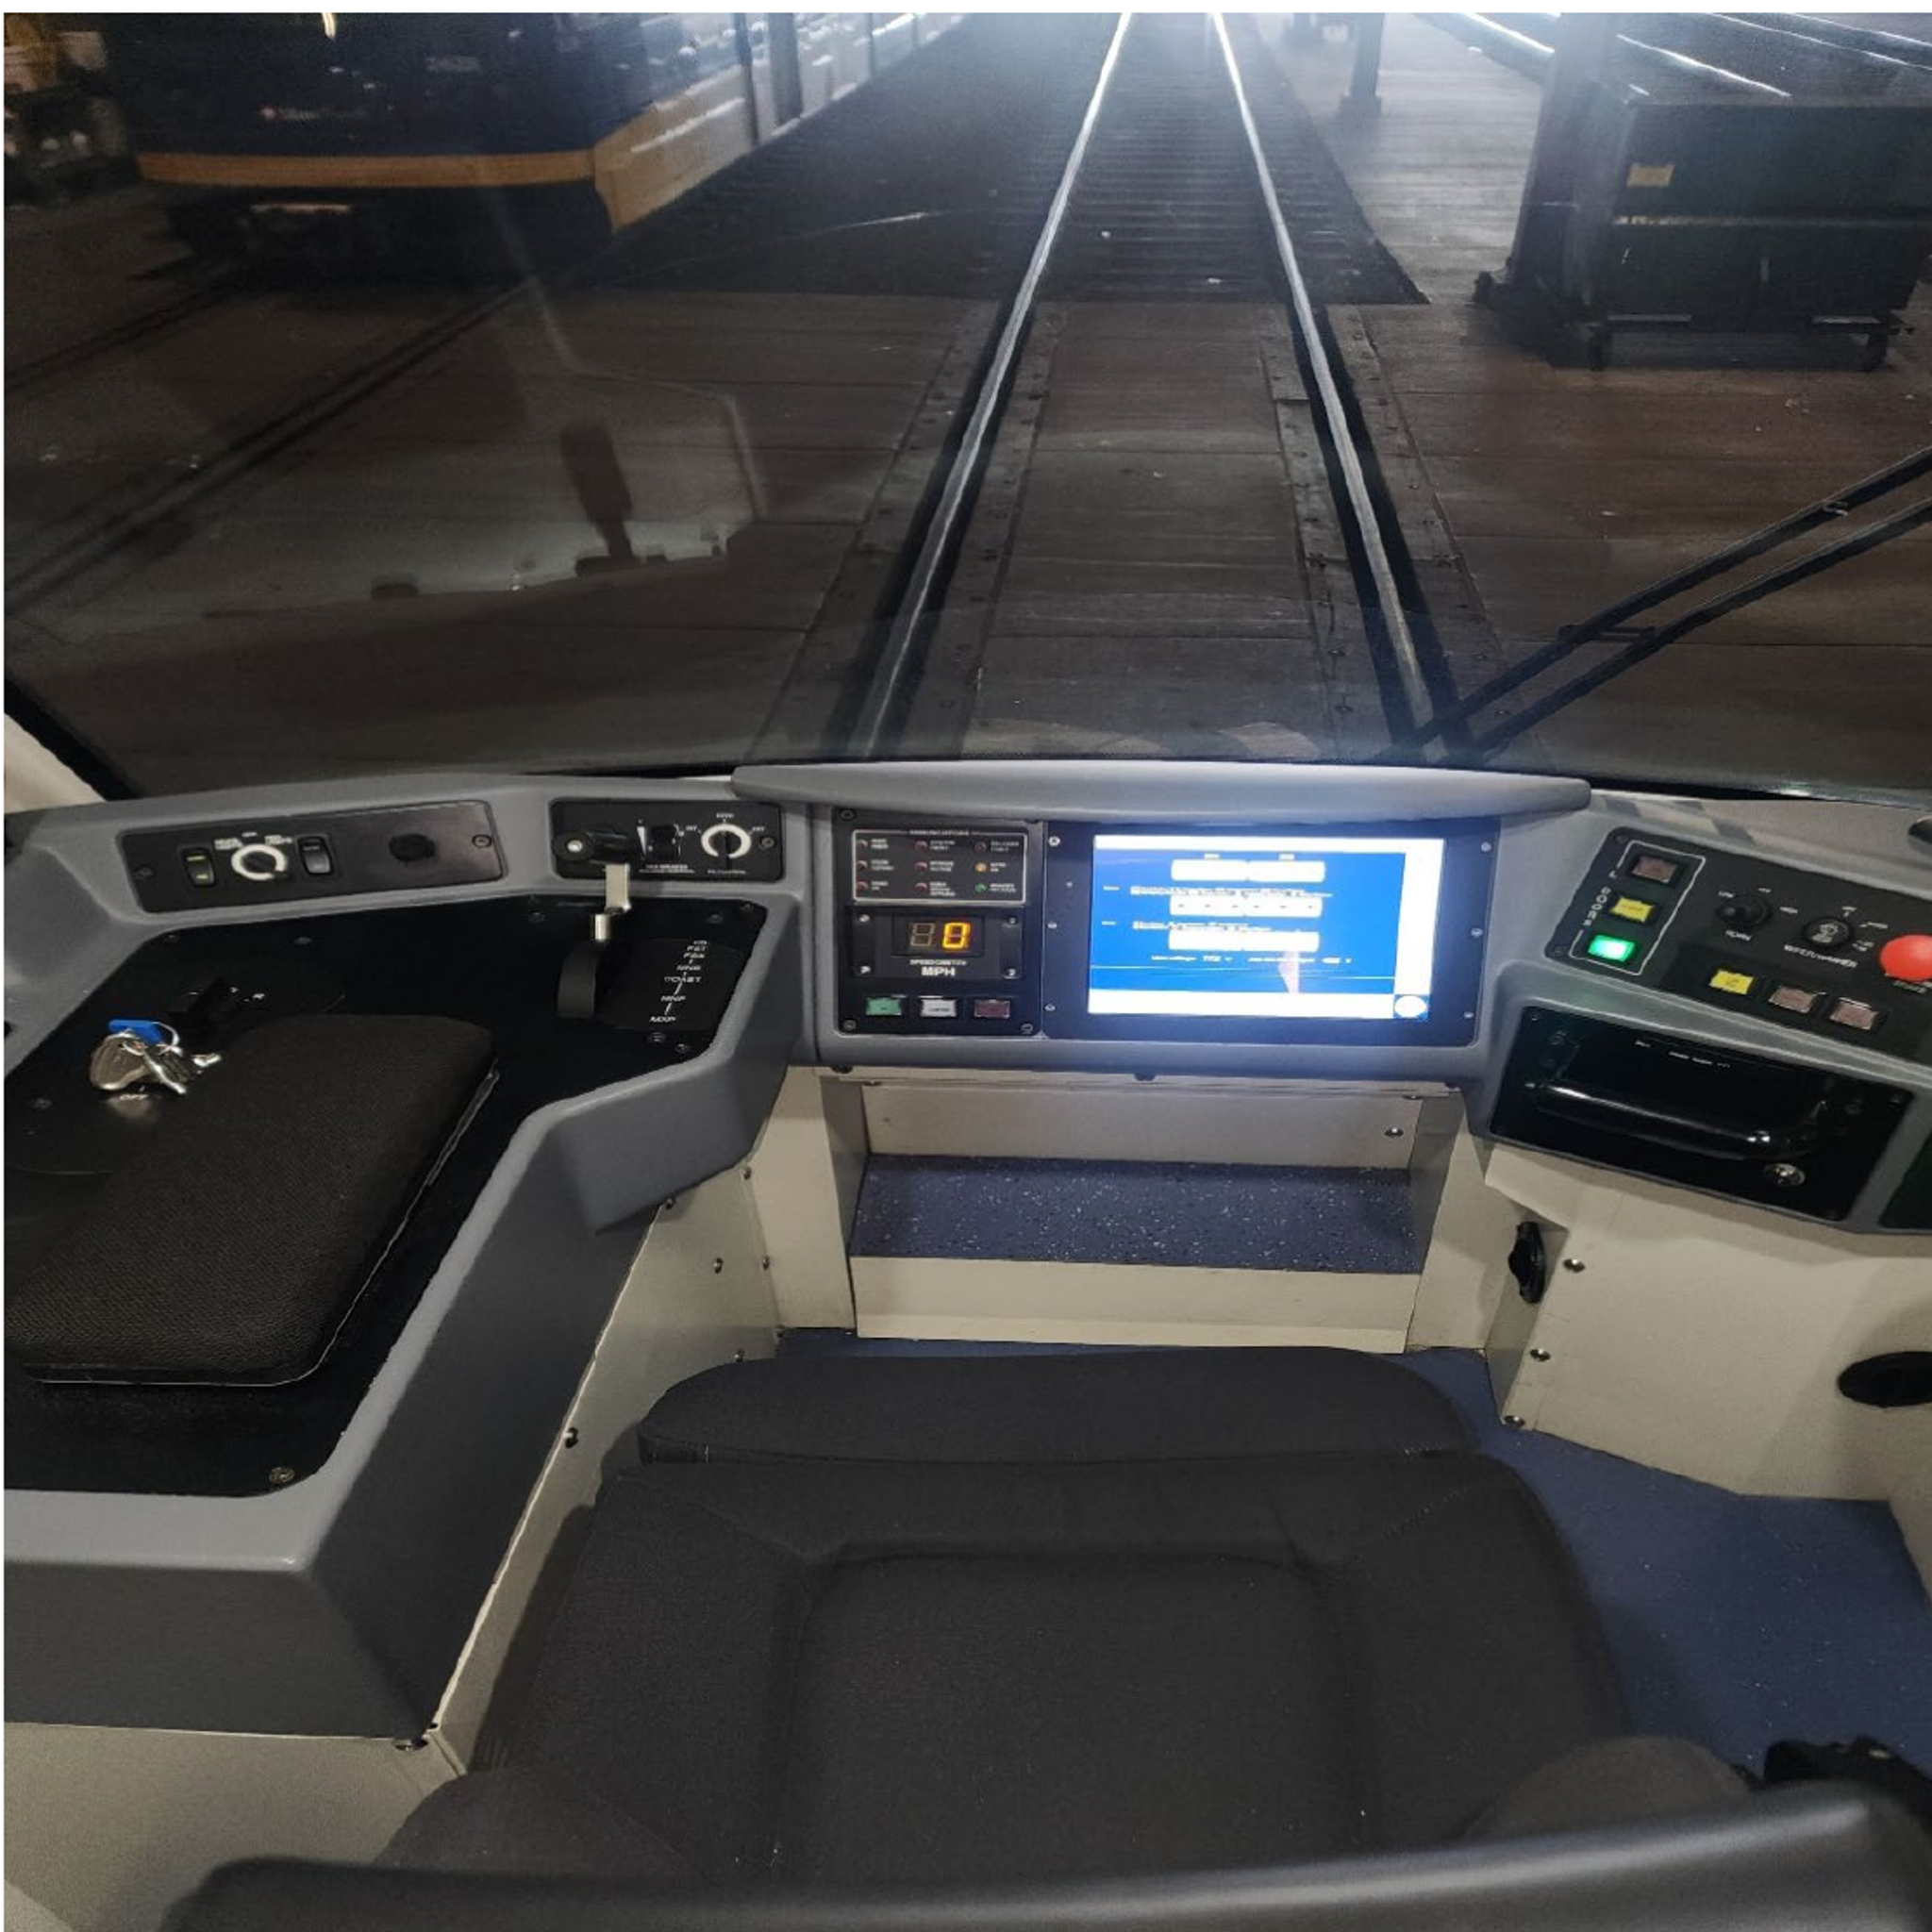
Interior cab154350043543$108,600High fidelity
Exterior cab198861298$19,600Exterior scope / livery
Train-car shell198861298$19,600Articulated consist definition
S70 vs. S700 visual delta18686086$17,200Confirm delta
Blue near-field track13 mi28.5279.591370.5$74,100Track / signals / catenary boundary
Green near-field track11 mi28.5236.577313.5$62,700Street-running complexity
Extension near-field track29 mi28.5623.5203826.5$165,300Immature source risk
Points of interest4021.58600860$172,000Needs tier list
Mid/far environment50 mi432,15002,150$430,000Procedural / reusable kit assumption
Yard / turnout environments45017228200$40,000Boundary required
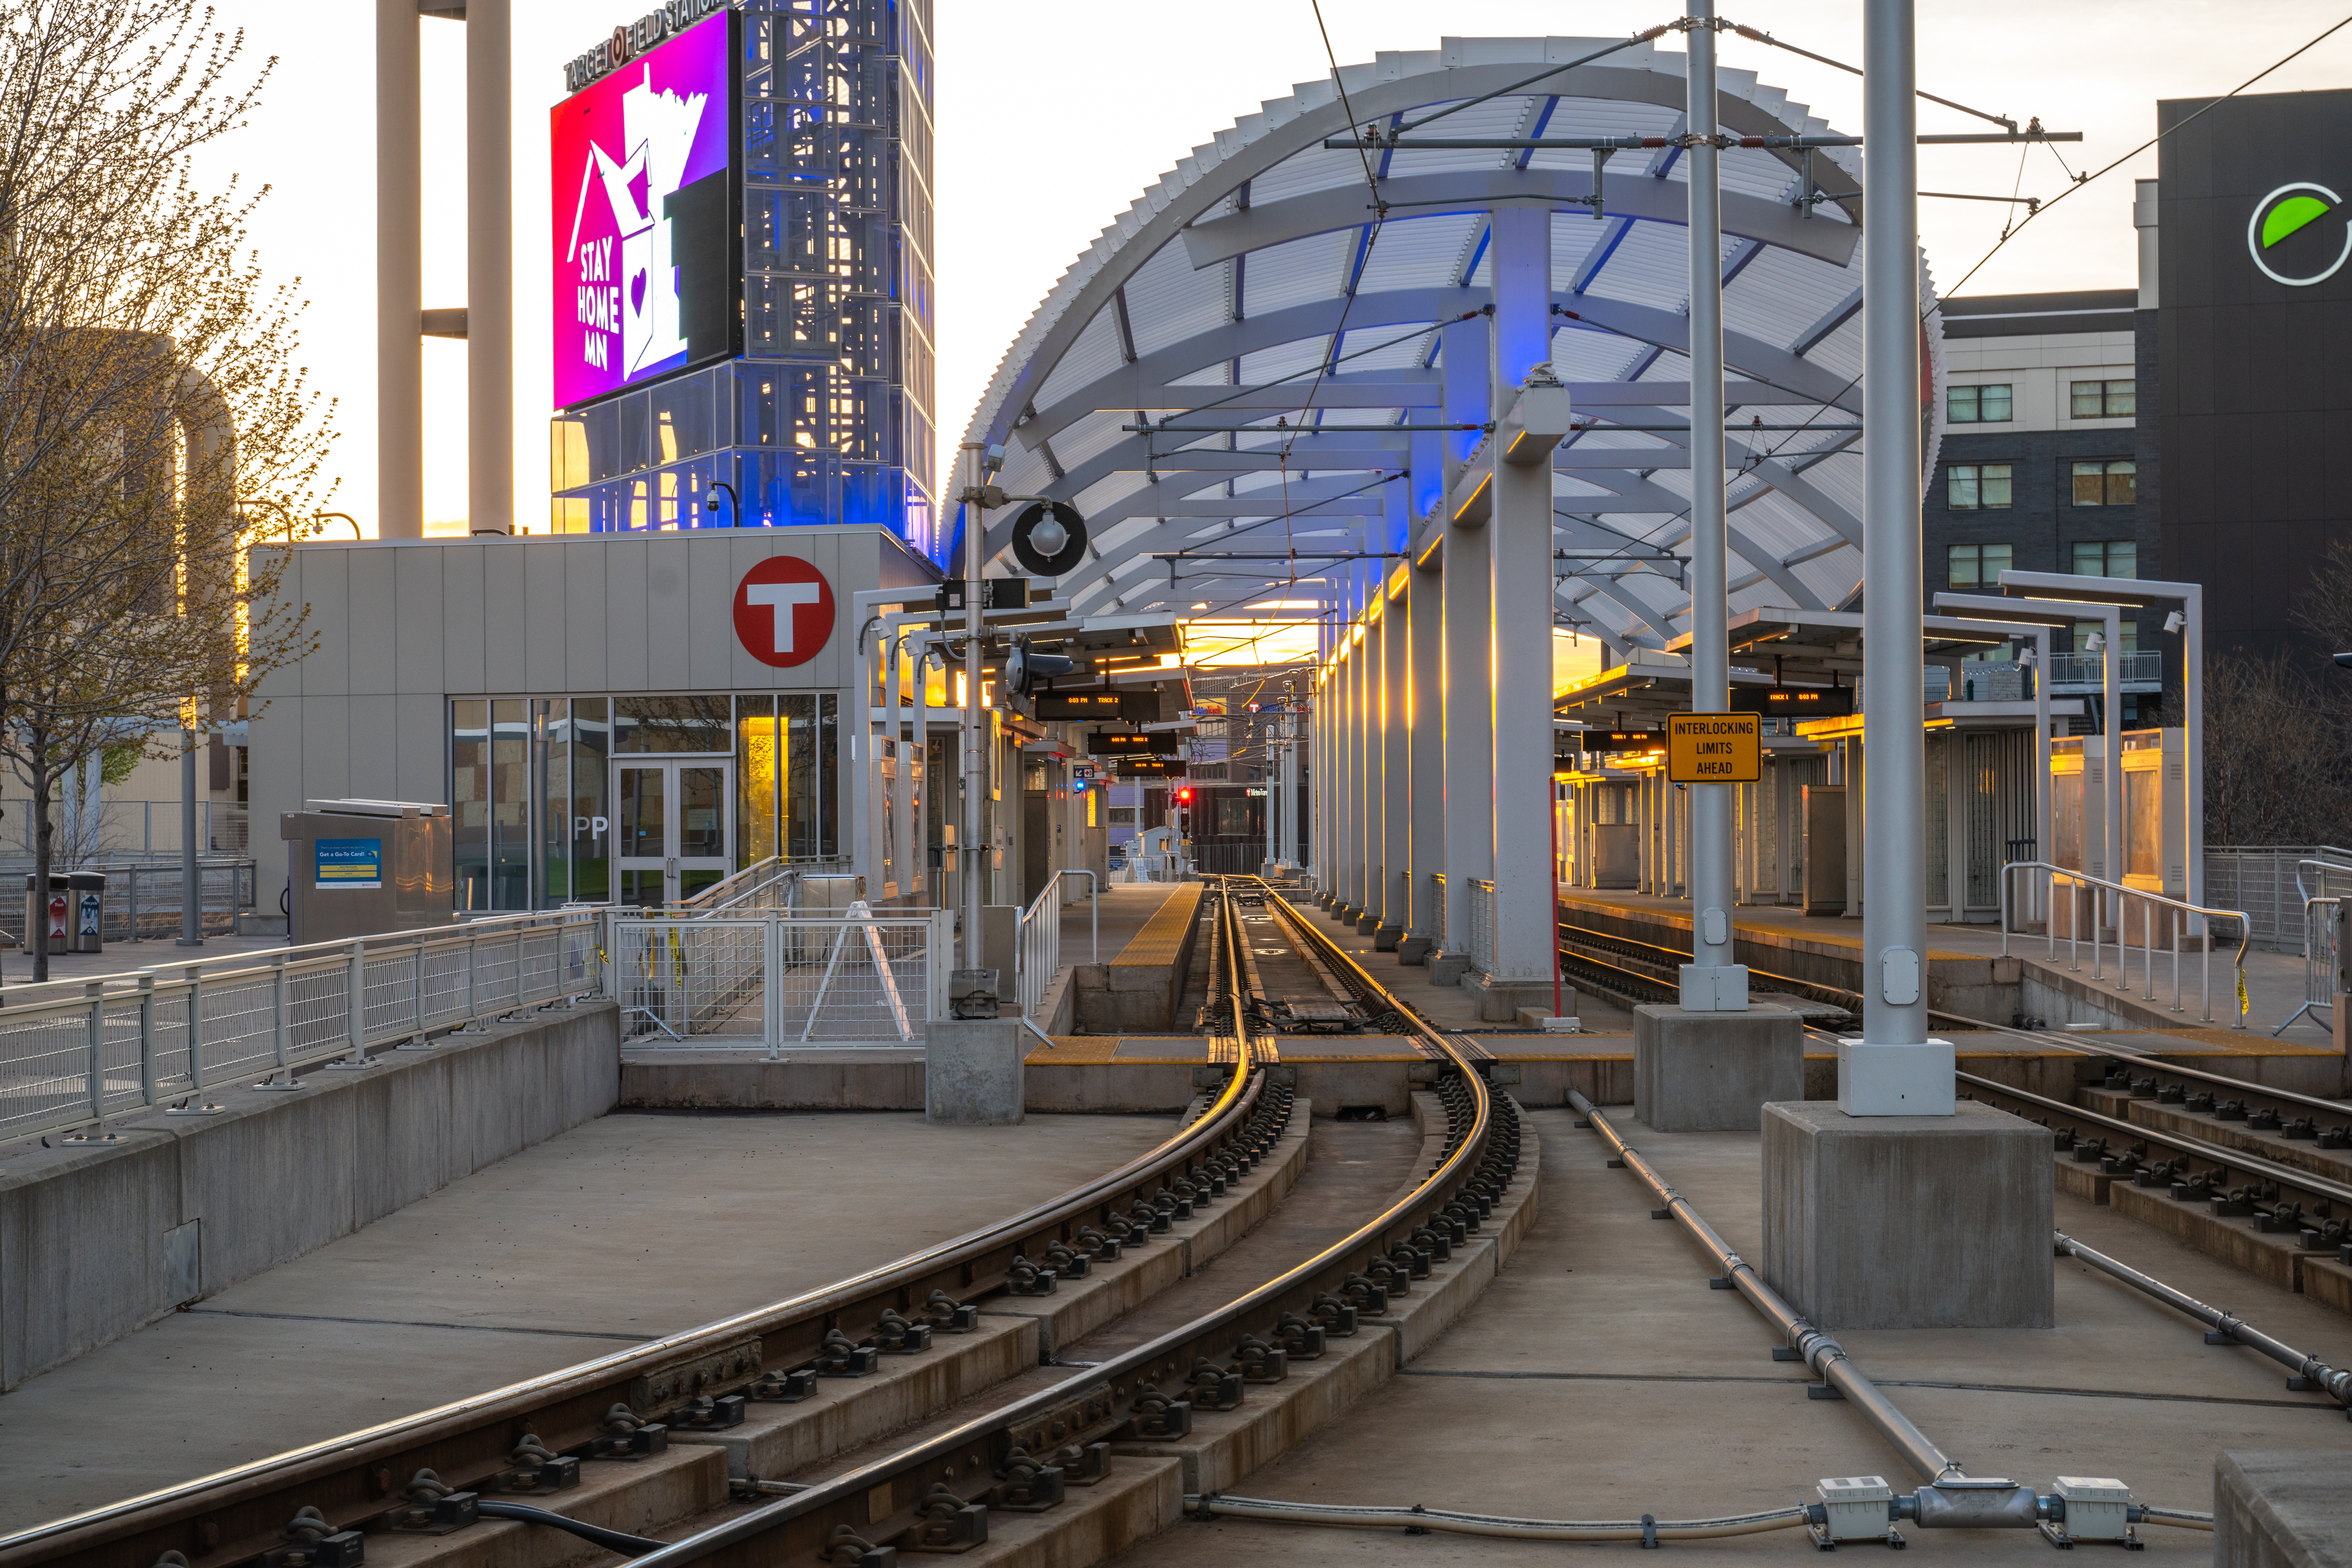
Unique stations27501,1611891,350$270,000Master asset + local variation?
Reused stations65025842300$60,000Qty + reuse logic
Explicit 3D production total6,498.56977,195.5$1,439,100Parent rows excluded

Scope boundary: this view includes only the explicit “3D Modeling — Train” and “3D Modeling — Full Train Routes” families. Technical-art hours embedded in controls integration, faults, networking, instructor tools, UI/display emulation, and provisional rows are excluded because they are not 3D art production line items.

Sanity check against prior art basis

The Total Matches; The Allocation Does Not

The near-perfect total match is useful, but it can conceal scope movement between stations, route work, landmarks, and vehicle work.

Prior 7,200-Hour Anchor

Buildings / streets + up to 12 landmarks
3,000 h
38 stations
3,100 h
Modular track / signaling
600 h
Cab model
500 h
Total
7,200 h

Internal working estimate cited in the Metro proposal context; not approved pricing.

Current Explicit Production

Mid/far environment + 40 POIs
3,010 h
Unique + reused stations
1,650 h
Near-field track + yards
1,710.5 h
Train package
825 h
Total
7,195.5 h

Station effort dropped 1,450 hours while track/yards and train increased about 1,435.5 hours. Validate the redistribution—not just the total.

Real source imagery

Reference Quality Drives the Estimate

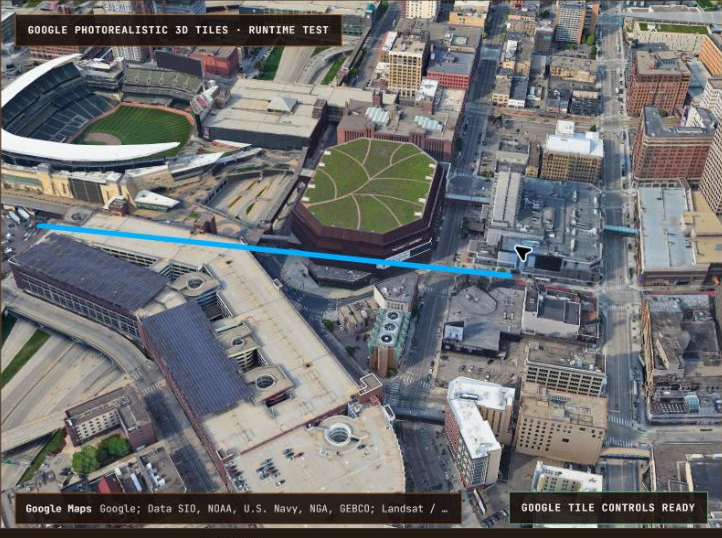
These verified references show the current source standard. They support review; they do not prove that all 50.75 route miles, stations, yards, S70 deltas, and 40 landmarks have equally complete inputs.

Fast review protocol

Questions for 3D Production Leads

If Brandon and River can answer these directly, the biggest pricing ambiguity collapses quickly.

What exactly is one station unit?One master design, one placed instance, or one location-specific final asset?
What changes on reuse?Platforms, shelters, signs, surroundings, lighting, materials, track geometry, or nothing?
Which 40 POIs are actually unique?Name and tier them. Hero landmarks should not share a flat unit rate with generic masses.
What is visible from every approved camera?Operator cab, instructor god view, replay, observer view, screenshots, and proposal capture may need different coverage.
What source package exists per route segment?GIS, CAD, point cloud, drawings, video, photography, map tiles, and change status.
What is the acceptance bar?Reference match, dimensions, materials, signage, nighttime lighting, optimization, LODs, and revision count.